Yesterday I came across this great article about Browser Monitoring at Github and how they use the Navigation Timing API to monitor page performance.
As I use Piwik to analyze and monitor the traffic on my site I thought about a way to combine both to monitor the load time of my site. After some testing, I came up with the following solution.
First of all we define a function to get the load time using the Navigation Timing API:
function getPerfTiming() {
    if ( !('performance' in window) || !('timing' in window.performance) || !('navigation' in window.performance)) {
        return false;
    } else {
        var timing = window.performance.timing,
            now = new Date().getTime(),
            start = timing.navigationStart,
            loadTime;

        loadTime = (now - start) + "ms";

        return {
            loadTime: loadTime
        }
    }
}
Use Piwik to save results #
Next we need to change the Piwik code used on the site. We need to define a custom variable before calling piwikTracker.trackPageView().
Using the function from above this looks like the following:
if (getPerfTiming()) {
    piwikTracker.setCustomVariable(
    1, // slot ID - up to 5 custom variables can be used
    "loadTime", // name of the custom variable
    getPerfTiming().loadTime, // value of the custom variable
    "page" // scope - page means it gets send on every page load
    );
}
piwikTracker.trackPageView();
Monitor results on your Piwik instance #
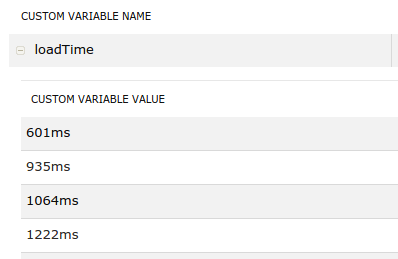
After logging into your Piwik instance, you can go to Visitors -> Custom Variables to all the variables you defined with piwikTracker.setCustomVariable

I implemented this today on my site and I am already really curious how the load time will differ for the users. To monitor other performance aspects like first paint, you can use additional custom variables if you like.